

By Julie Steiner, Senior Director of Admissions and Retail Operations at the Barnes Foundation
The 2025 MSA Retail Industry Report (RIR) offered museum store professionals a lot of numbers, but what do they mean for your store? This 2-part series will walk through some of the charts full of numbers and help you apply them to your store’s unique operations. Just as a doctor understands that individual symptoms can have multiple causes and require correlating other data points to understand, you, as a retail professional, can use multiple data points to gauge the “health” of your business. Each statistic can indicate many factors at play in your business. We’ll describe some of the factors that influence both the medians in our museum store industry and the deviations from them.
Let’s start by unpacking some straightforward data points (average transaction, sales per square foot, and online sales as a % of revenue), and in the second part of the series, we’ll move on to stats that point to more complex or nuanced situations.
1) DATA POINT: Average transaction
What it is: The average value of each sale made in your retail store.
How it’s calculated: Total sales amount in dollars divided by the number of transactions.
Why it matters: Each transaction in your store means you’ve successfully converted your guests to museum store shoppers, and your browsers into buyers. This metric can tell you whether your product selection maximizes how much your customers spend to support your museum store.
What can influence it:
- Product variety and pricing
- In-store browsing experience
- Information available on the products
- Customer service experience
- “Up-selling” in the store
What the MSA Retail Industry Report says:
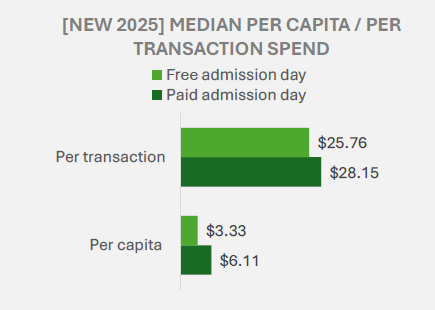
The MSA RIR has not historically looked closely at per-transaction spending, but in the latest report, it examined per-transaction spend on free days vs. paid days and concluded that free admission did not equate to increased retail spending.
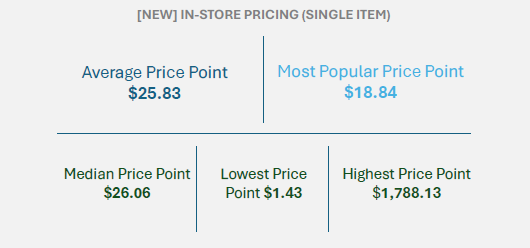
The RIR also looked at single-item price points, which differ functionally from per-transaction numbers but also give us an idea of the value of items customers are most likely to purchase in museum stores.
If yours is higher than median:
- It could indicate high engagement in that buying process, upselling by sales staff, and customers adding on extra “finds” to their purchase.
- It could indicate a store that has chosen to invest in and emphasize high-price-point products, like the work of local artists and artisans, fine jewelry, or other goods that appeal to high-end customers.
- Perhaps the museum’s mission and/or collection is one that appeals to an exclusive audience, and a higher average transaction supports this mission-driven business direction.
- However, this is one of many numbers that should be paired with other “diagnostic symptoms.” If, for example, a high average sale is accompanied by a low capture rate (a data point covered in the next post in this series), it might mean that a store is missing merchandise options in the lowest price ranges, and customers who only want to spend a small amount are skipping out on a potential transaction altogether.
If yours is lower than the median:
- It could be a sign of high reliance on low-cost items to overall sales. This will be especially common in museums that cater strongly to school groups and families with children.
- It could indicate a lack of increasing price points to match inflation, or changing consumer views on perceived value. (For example, a museum store offering postcards for less than $1, where standard rates for paper products have long been increasing.)
- It could mean a lack of diversity in available price points in the shop. Retail buyers may hesitate to bring in items priced above the perceived norm, or to test the upper limits of what guests, donors, and members are willing to buy.
2) DATA POINT: Sales per Square Foot
What it is: Retail revenue per square foot of retail store space
How it’s calculated: In-store sales (annual) divided by the square feet of the physical selling floor
Why it matters:
This can indicate not only the store’s overall health, but also highlight areas of operational need. This is another data point that varies widely from the commercial/for-profit retail world.
Some comparisons from the commercial retail sector include:
- $150-300 for independent bookstores*
- $550 for supermarkets**
- $150-$450 for major department stores***
What can influence it:
- A store that is physically out of scale (either too large or too small) for the volume of visitors coming into a museum or attraction
- A store that is not maximizing its merchandising potential (shelves, displays, windows, sight lines)
- A store that doesn’t match consumer expectations in product assortment, pricing, and availability.
What the MSA RIR says:
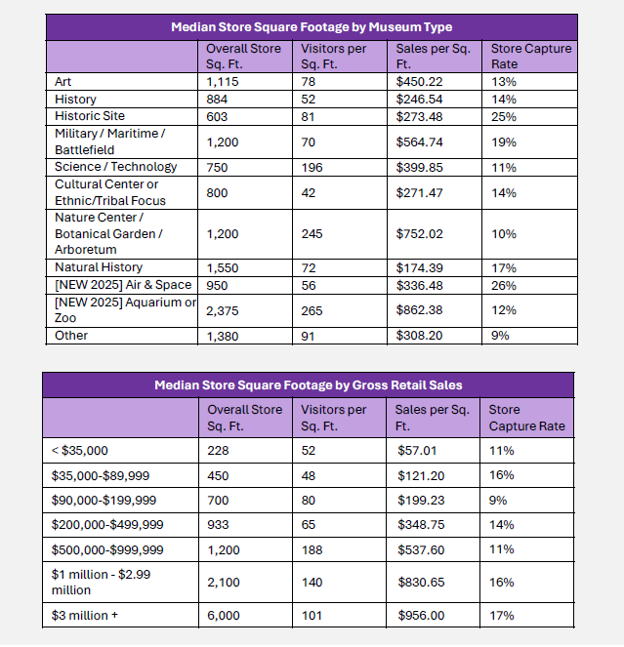
Sales per square foot varies by both museum type and store size, with the largest stores welcoming the most visitors per square foot and generating the highest spending per square foot.
If yours is higher than the median for either your category or volume:
- Congratulations, you may be maximizing the physical space on offer to your retail operation
- However, high sales per square foot can bring about operational challenges, such as staffing: do you have enough sales associates to be able to ring up visitors in a timely manner? (For correlation, see also: personnel expenses. Those may also be higher than median as a result of your store’s physical needs.)
- Check your purchasing flows—is your team properly supporting the inventory flow required to turn over an inventory in a high sales-per-foot environment? (See also: inventory investment, size of stock room, and COGS)
- The demands of a high-turn retail sales floor can put pressure on storage spaces, loading docks, a finance team (processing purchase orders, invoices, payment processing), and other operational junctures. Use your comparisons to advocate for the needs of the staff and systems supporting this result.
If yours is lower than the median:
- This could mean your museum has successfully offered abundant retail space for the number of visitors coming through your site.
- Make sure you’re maximizing the available space with a diverse and appealing product assortment
- Watch out for any “dead corners” or areas of the store where customers can get lost, and products can go stagnant
- You may also find that you don’t need as much store-room stocking space, as your shelves on view are ample for your product assortment, but make sure you’re stocking appropriately and keeping displays looking fresh and appealing
- Think about ways to take full advantage of your available space to invigorate the sales floor, and increase either capture rate or average transaction. This could mean adding coffee or food options, or a reading nook to a book or children’s section.
3) DATA POINT: Online sales by % of revenue
What it is: The proportion of your store’s retail sales that took place online.
How it’s calculated: Online sales divided by total retail sales.
Why it matters: Understanding the role that eCommerce plays in the landscape of your retail business helps you allocate resources, staff time, and marketing appropriately.
What can influence it:
- Your museum or attraction’s online “destination” factor
- Visitors using the website to learn more about your organization either before or after their visit
- Retail product distinct to your museum or attraction
- A streamlined, shoppable eCommerce site (which can include quality photography, well-written descriptions, intuitive categorization, and clear links.)
- Robust marketing initiatives that connect with a designated demographic
What the MSA RIR says:
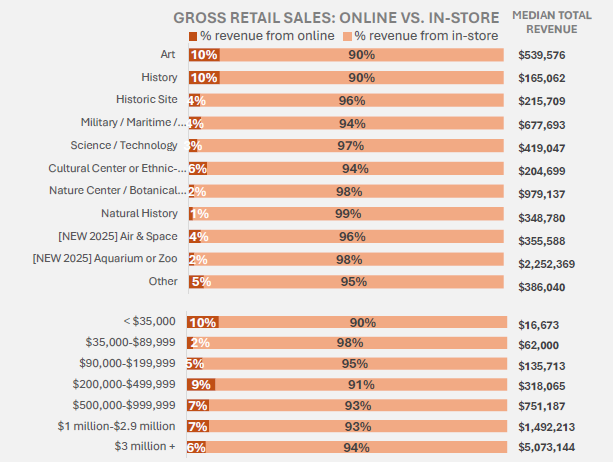
- Online sales by percent were 6% overall.
- Online sales play a larger role for Art and History museums, and a smaller role in Nature Centers and Botanical Gardens, Aquariums and Zoos, and Natural History Museums.
If yours is high, it can indicate:
- Offering a selection of products unique to your museum that can’t be found elsewhere.
- Successful marketing of your online offerings.
- An internet audience for your store that might stand apart from the in-person visitors to your museum or attraction.
- Capitalizing on a niche subject.
If yours is low, it can indicate:
- A museum or attraction in competition with a wide variety of other museums whose offerings appear less distinct in the ecosystem of the internet (zoos and aquariums, for example)
- Less reliance on custom or exclusive products.
- A lack of distinct offerings (This isn’t to blame the store—some sites offer content that is distinct within their geographical area, but relatively common in the overall marketplace, e.g., botanical gardens).
Conclusion:
The Retail Industry Report includes many additional diagnostic data points worth considering, including some new in this edition, such as personnel expenditures and Personnel as a percent of revenue. Hopefully this exercise has given you practice that can serve as a solid foundation for considering your individual metrics compared to industry “norms.” And as with medical diagnosis, complexities and variations occur within the norm, and situations that make the same data point “healthy” for one individual, but “symptomatic” for another. Interested in this subject? Feel free to reach out to me with your specific store’s “diagnostics,” or if you have seen particular data points in the Report that brought surprises and clarity, which you might like to learn more about in a future post.
In Part 2 of this series, we’ll “diagnose” three more data points for your museum store, including Capture Rate, Cost of Goods, and Inventory Valuation.
* Source: dojobusiness.com
** Source: stantcr.com
*** Source: Statista. Department Stores in the U.S. (2024)

Julie Steiner is the Senior Director of Admissions and Retail Operations at the Barnes Foundation and Calder Gardens in Philadelphia. She writes, teaches, and consults on a variety of fine art, retail, museum, and financial topics. A past president of the Museum Store Association, Julie received the 2019 “M Award for Excellence”. Julie volunteers for MSA in various capacities, has participated in the Retail Industry Report task force over many cycles, and advocates for data-driven decision-making in museum operations.